Sports Bra Design Optimization
If you’re curious for more details, feel free to read my thesis or the more condensed published paper on this research:
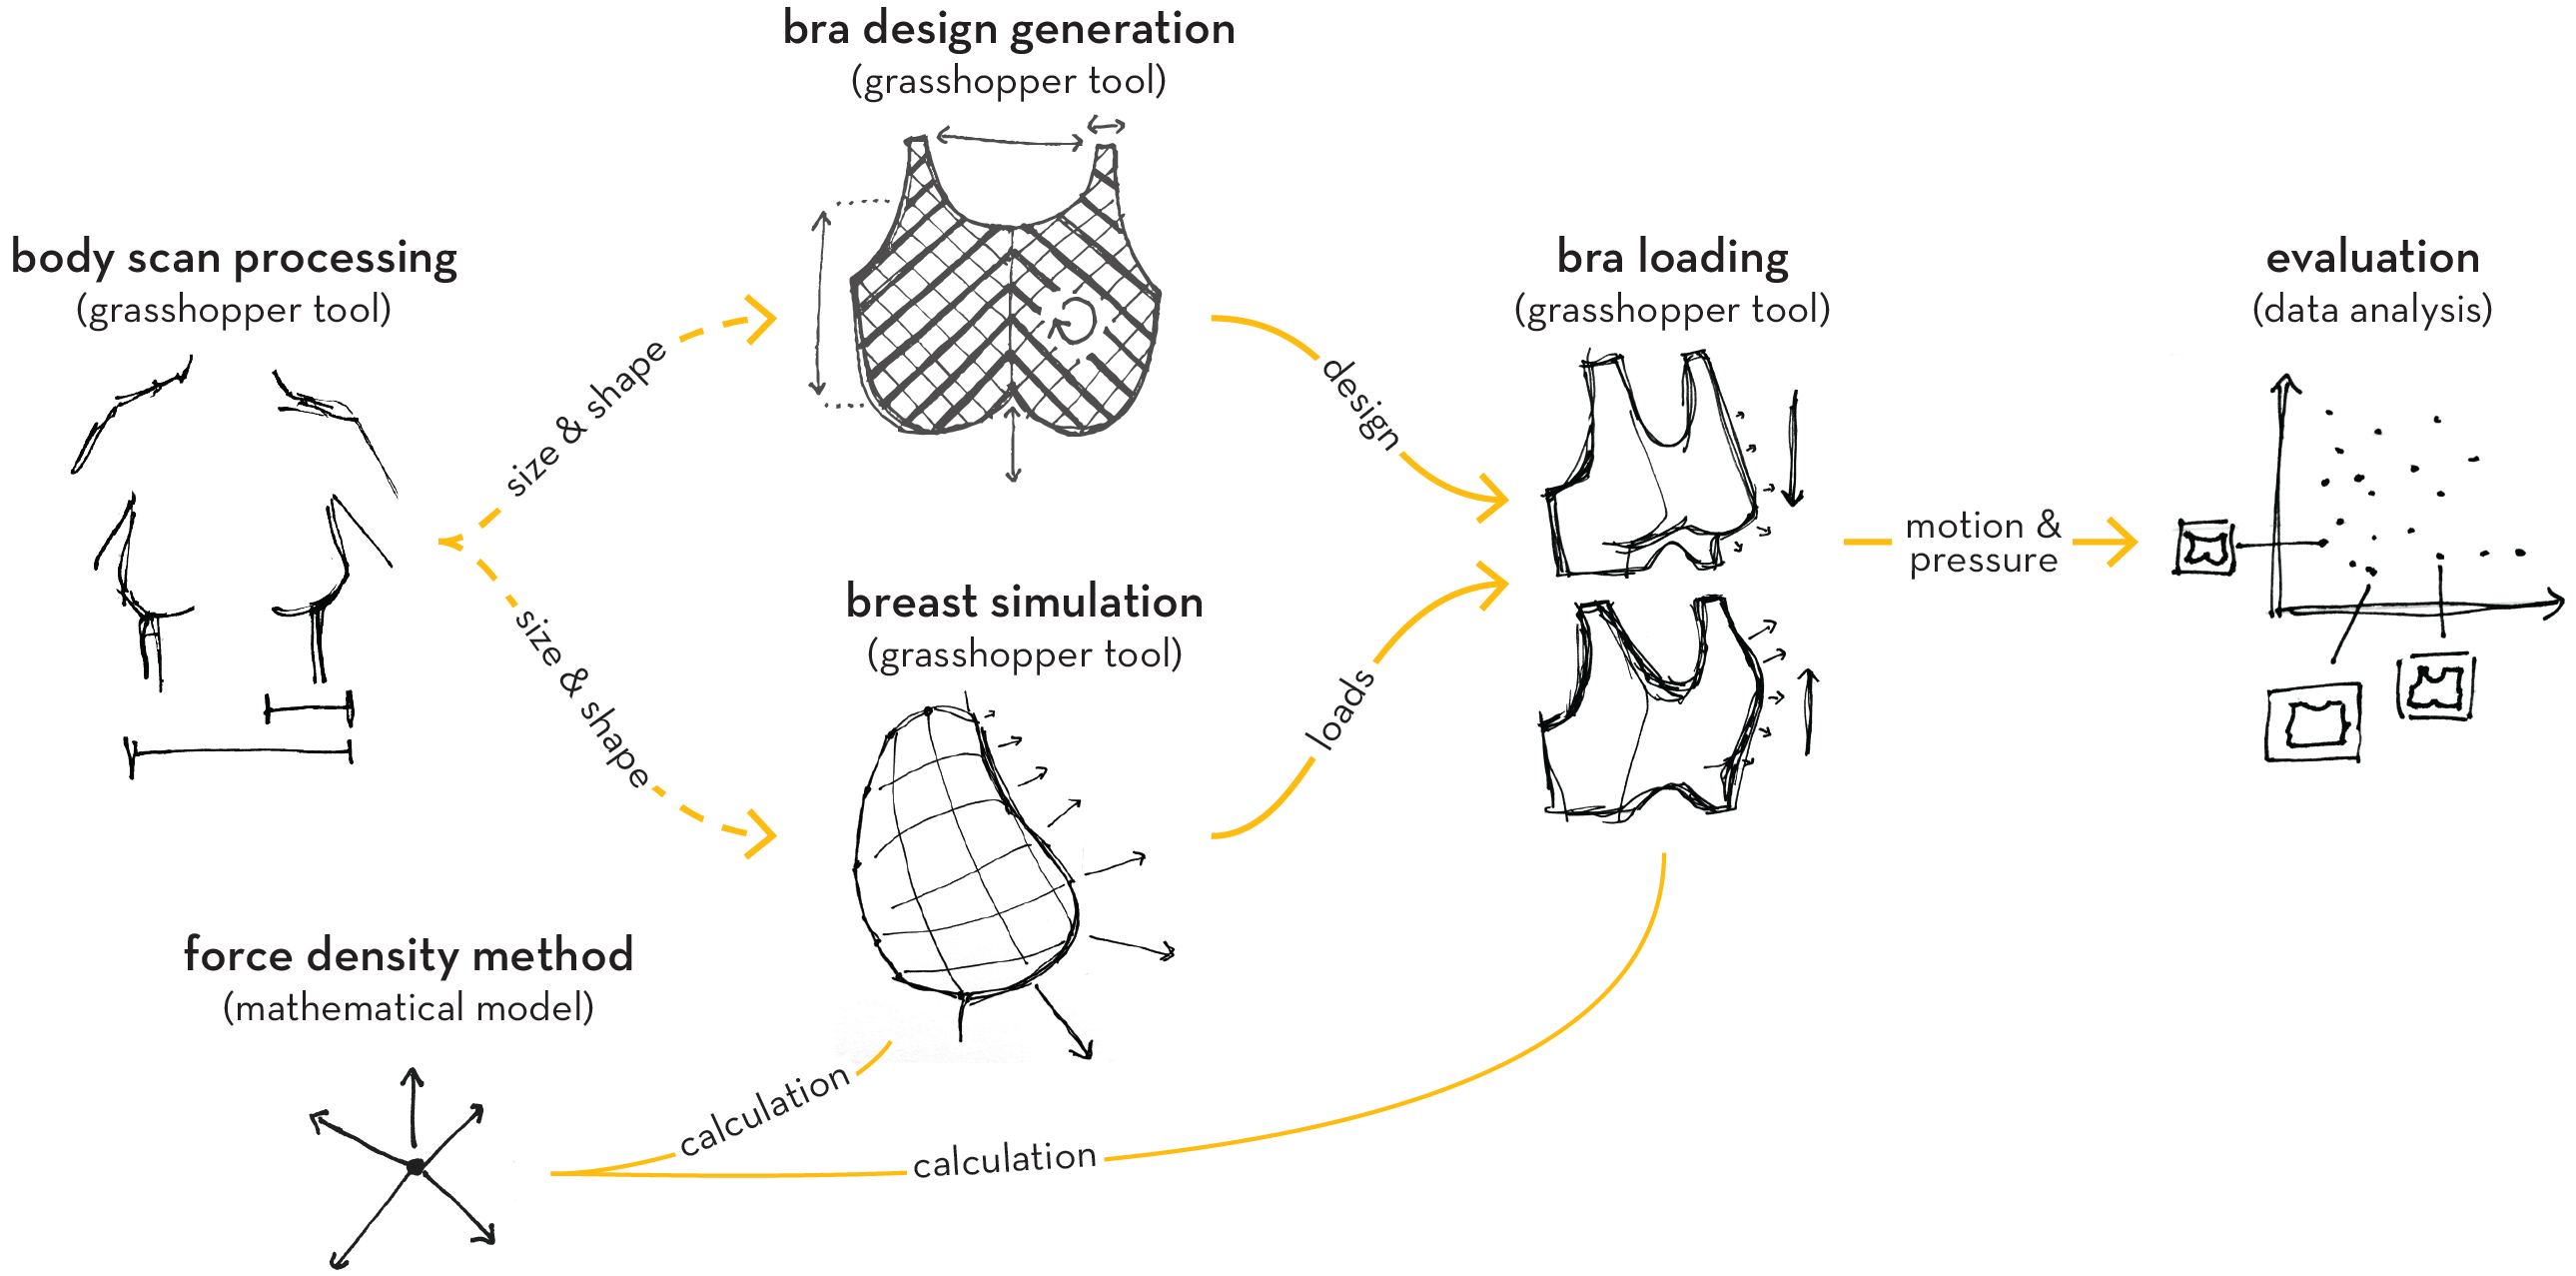
The goal of my masters thesis was to better understand the sports bra design space and how changes in designs could affect their performance objectives. In order to answer those questions, I created several software tools (in Grasshopper 3D) to: extract measurements from body scans, generate bra designs, simulate breasts, and test the generated designs according to the simulated breasts.
These tools and how they are used together are illustrated in this diagram:
Measuring and mapping body scans:
I created a grasshopper afnd python tool to automatically detect landmarks on (almost) any female body scan and applied it to a data set of 583 body scans.
Landmarks identified:
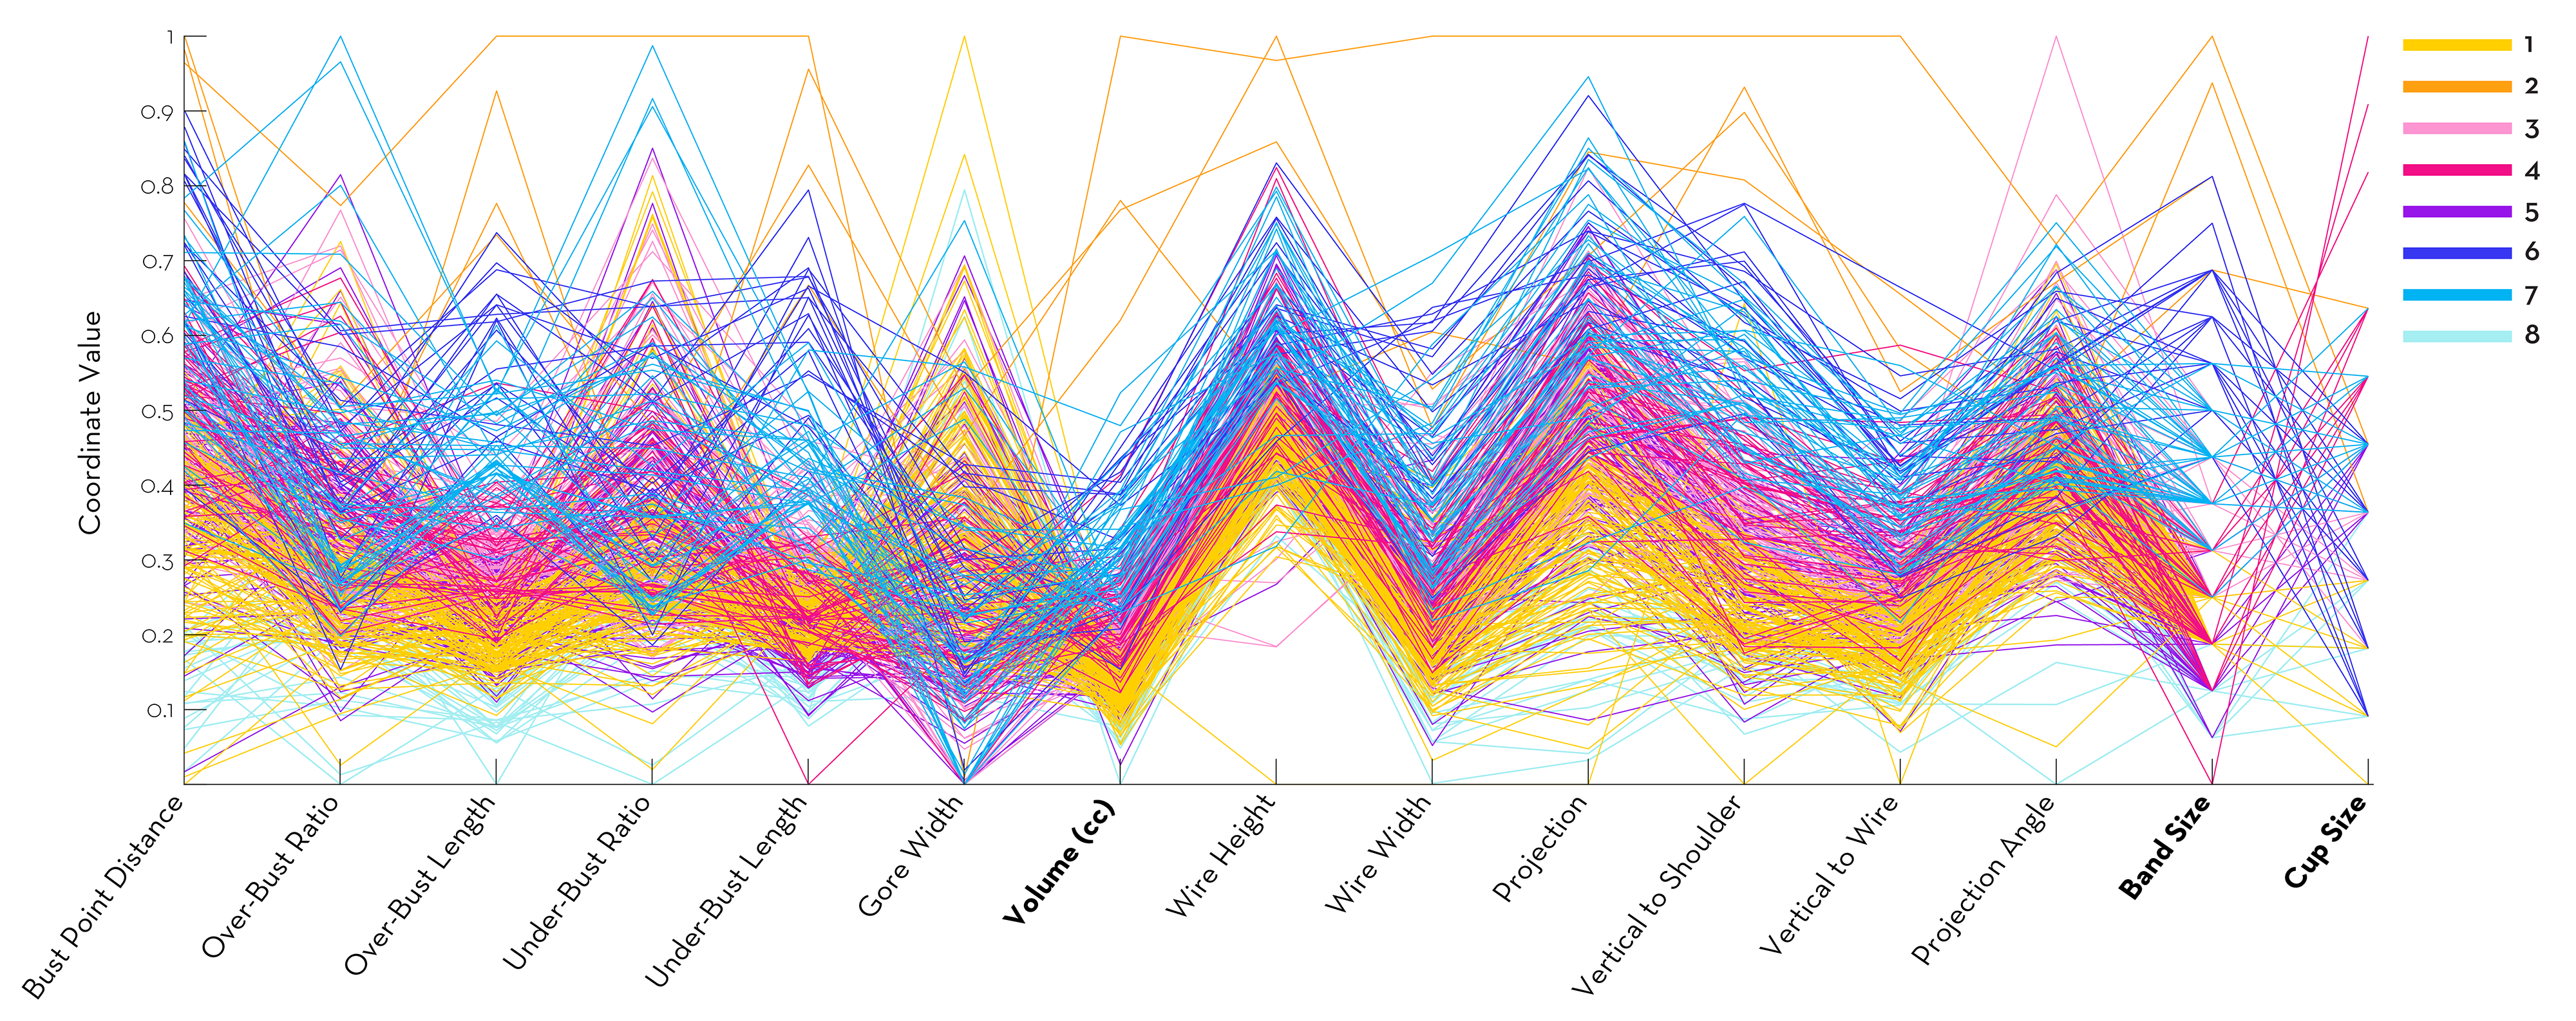
This resulted in numerical data on the body shape and size of (almost) 583 women, which I then performed simple machine learning analysis on to map body scans to 8 clusters based on band measurements and cup volume:
Parallel coordinate plot of body parameters
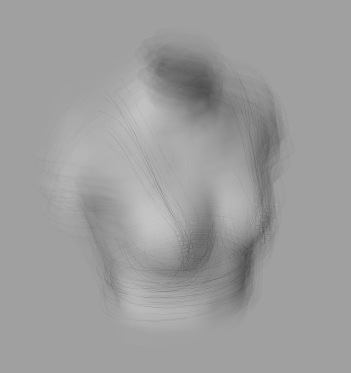
Averaged images of body scans to visualize clusters

Generating bra designs:
A large part of this research was to define new, scientifically motivated design directions for improving sports bra performance. While there are many objectives we can try to achieve to improve sports bras, I've focused on reduced range of breast motion and reduced average pressure.
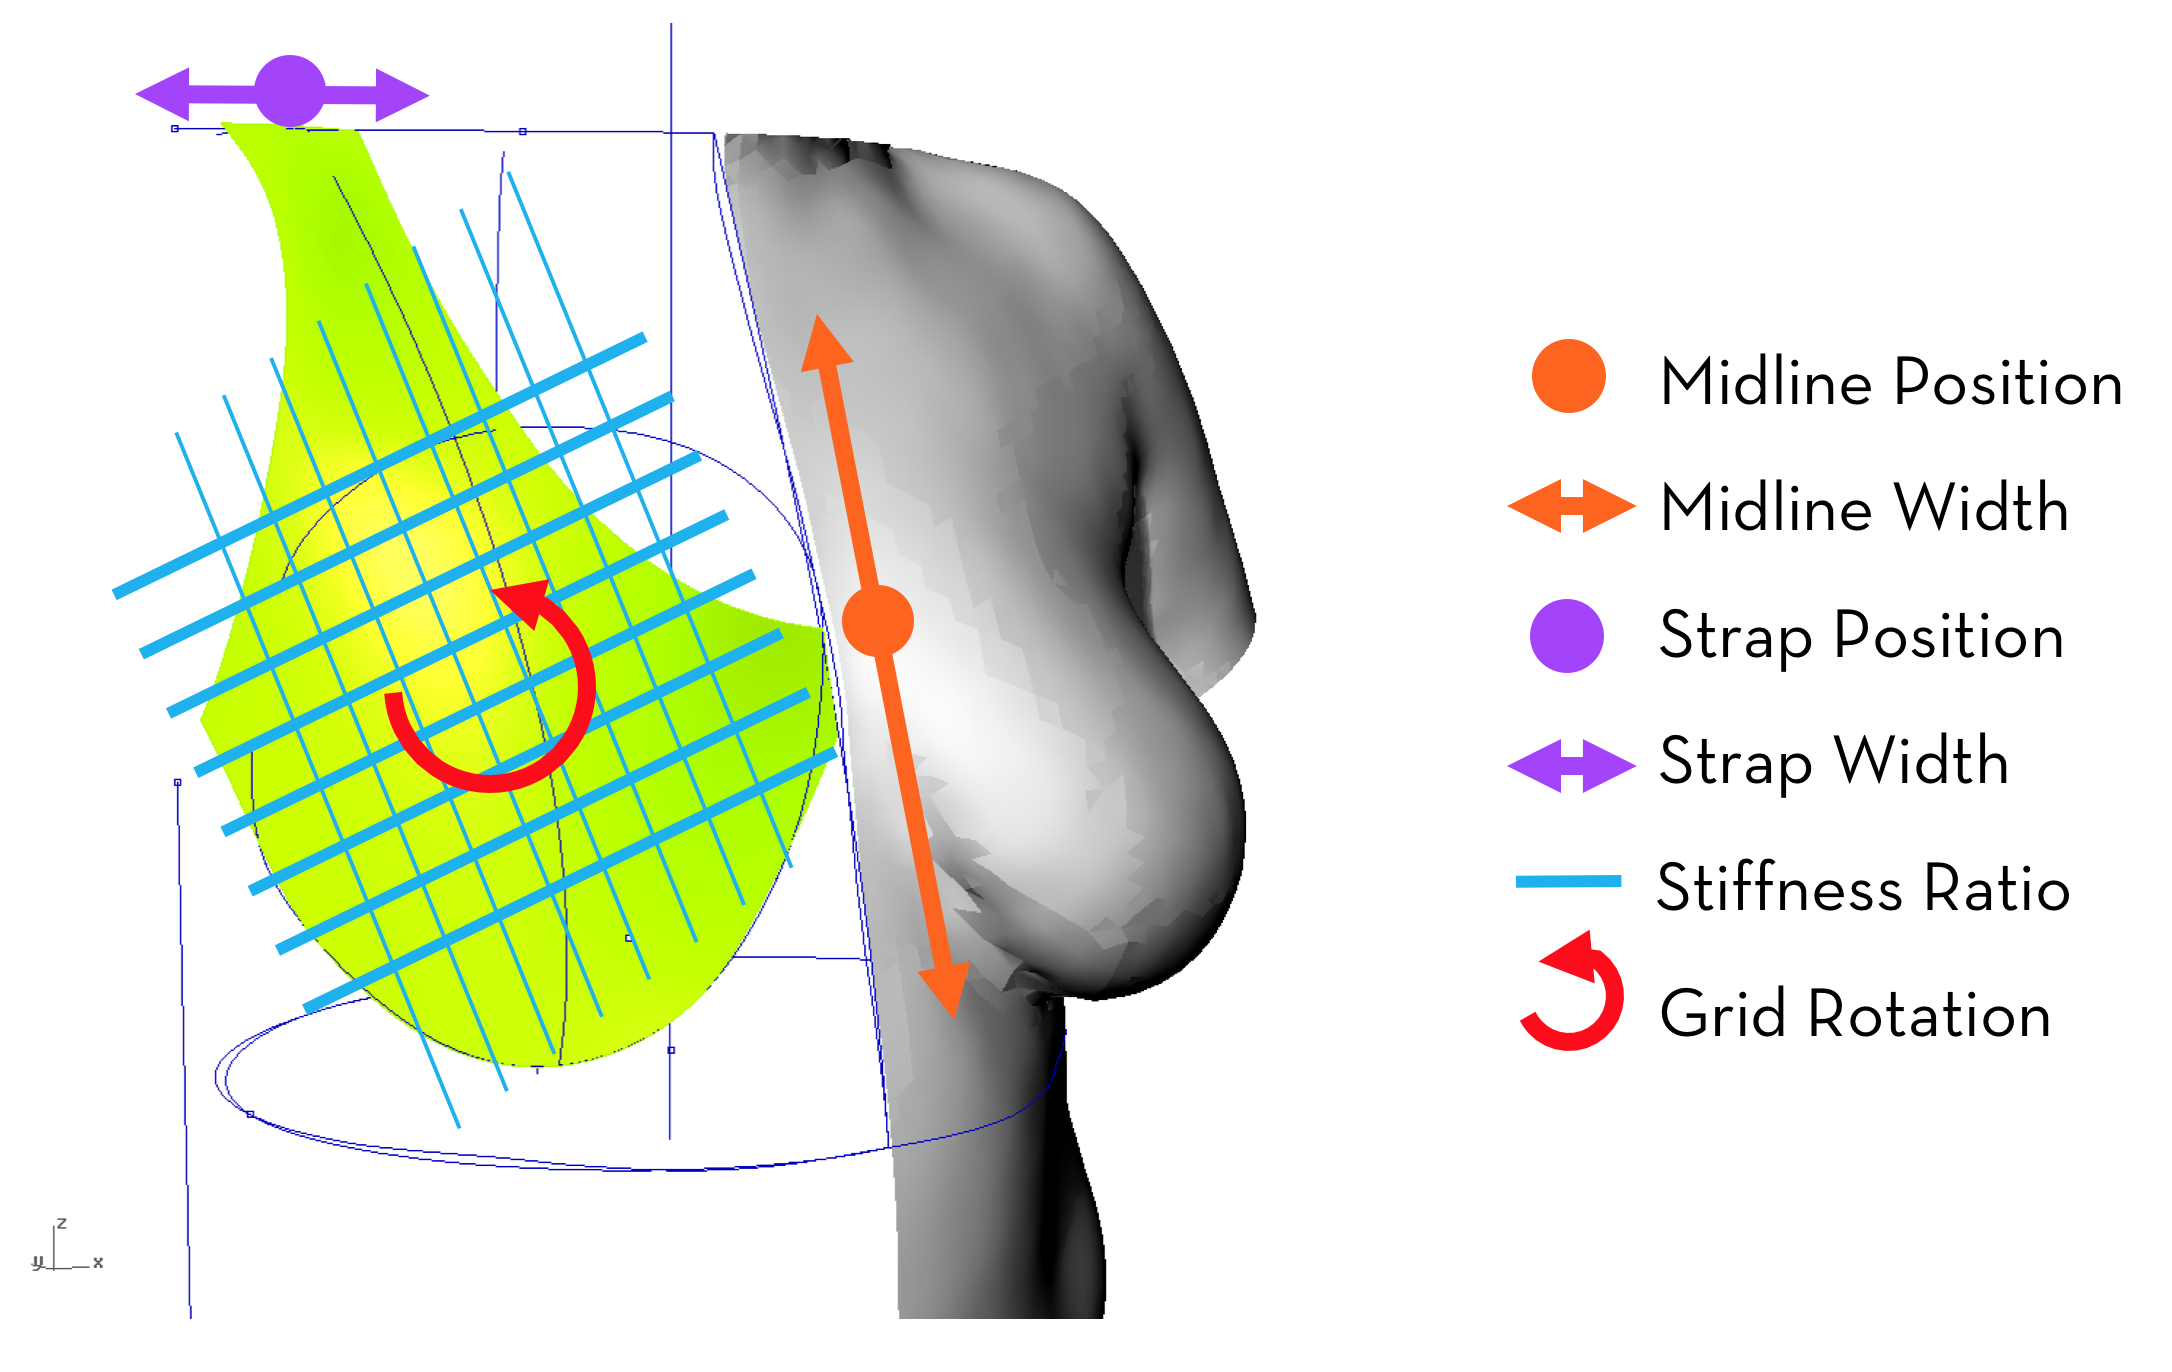
In order to understand the affect of different design parameters on bra performance, I needed to be able to create designs with specific parameters for testing, and create many of them to determine trends. I created a grasshopper tool to generate simplified bra designs based on 6 parameters:
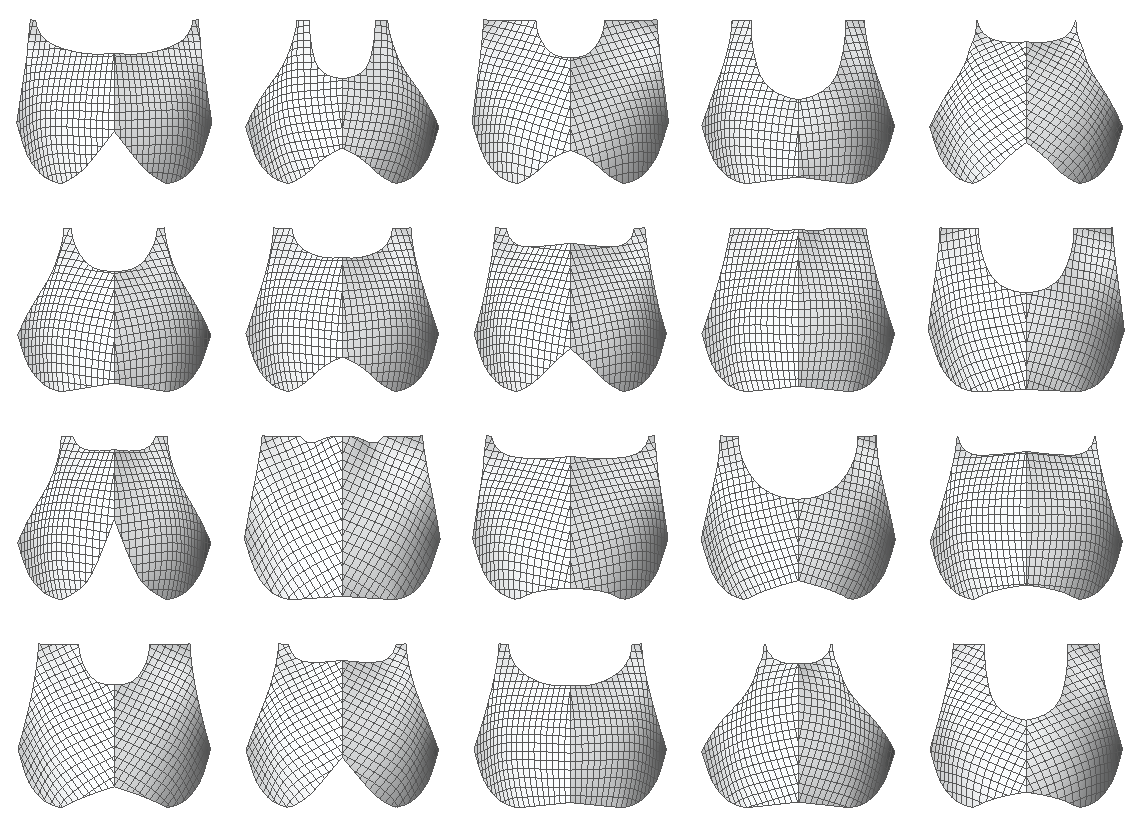
Here, you can see a sampling of some of the bras generated with the design tool:
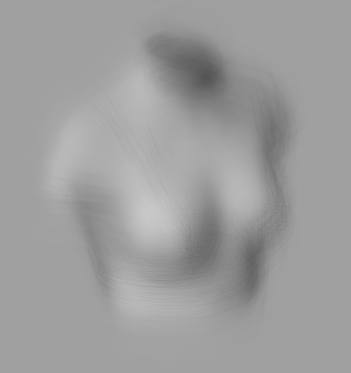
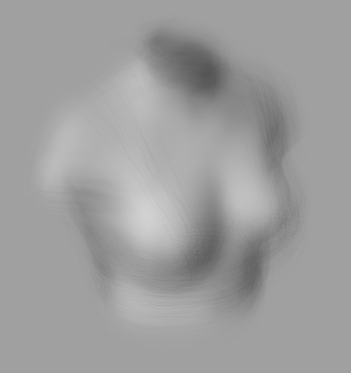
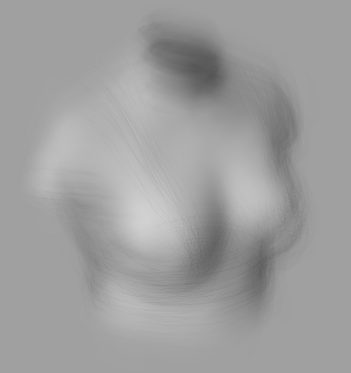
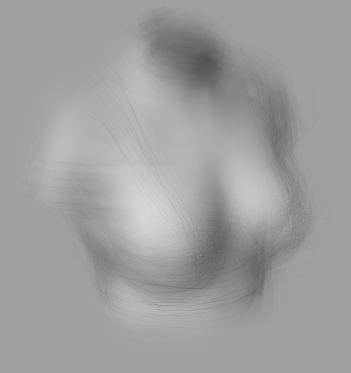
Simulating breast loads:
Breast and bra simulations were calculated using the force density method (FDM), which I implemented by writing a custom Grasshopper component in C# and Visual Studio.
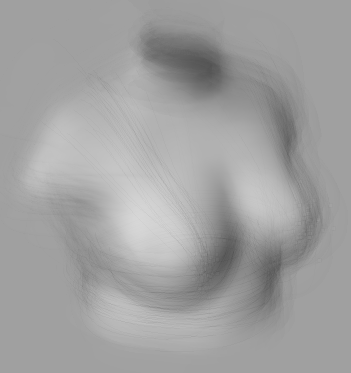
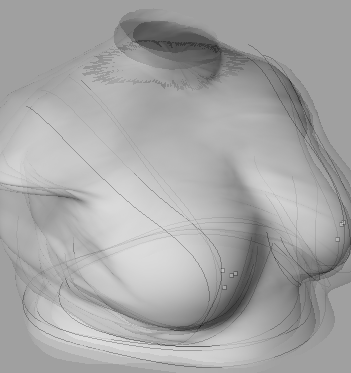
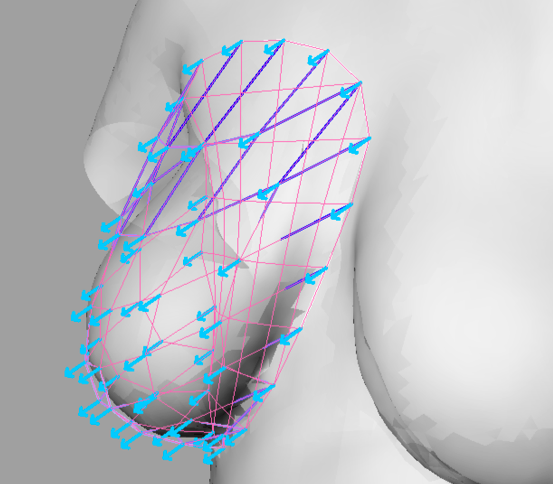
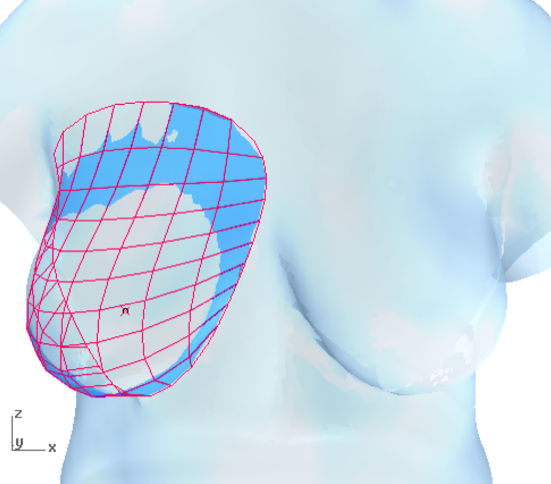
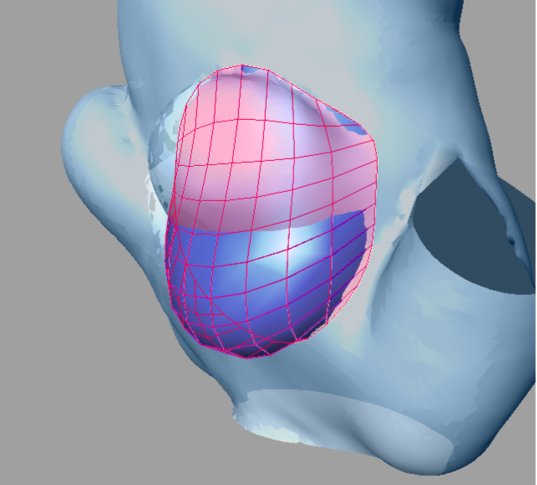
These following images show an initial FDM breast with uniform loading, a later (more accurate) step with non-uniform loading representing hydrostatic pressure, and the same model when loaded upside down (this is used to test range of motion)
Evaluating performance:
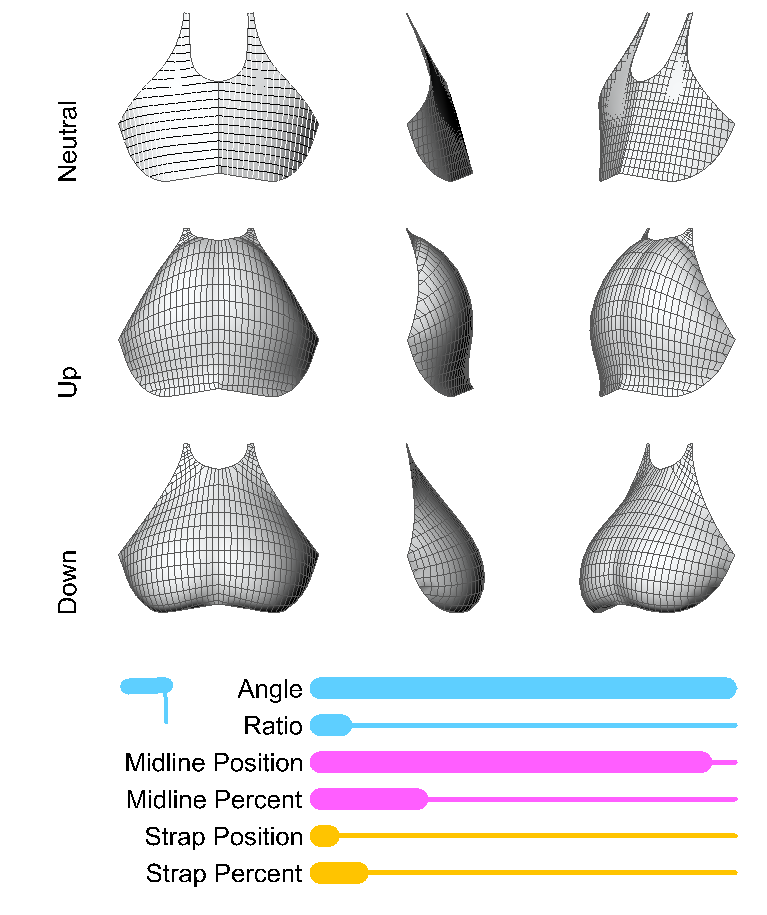
Each bra design is then tested using data from our breast simulation, and their performance (estimated pressure and total movement between loading scenarios) is recorded. These tests can be visually checked using images saved by the tool. See for example, these three generated bras and their visually represented performance under each loading scenario:


The performances of these designs can now be plotted against design variables to get a sense for how variables in the design process effect performance, and what designs could be optimal:
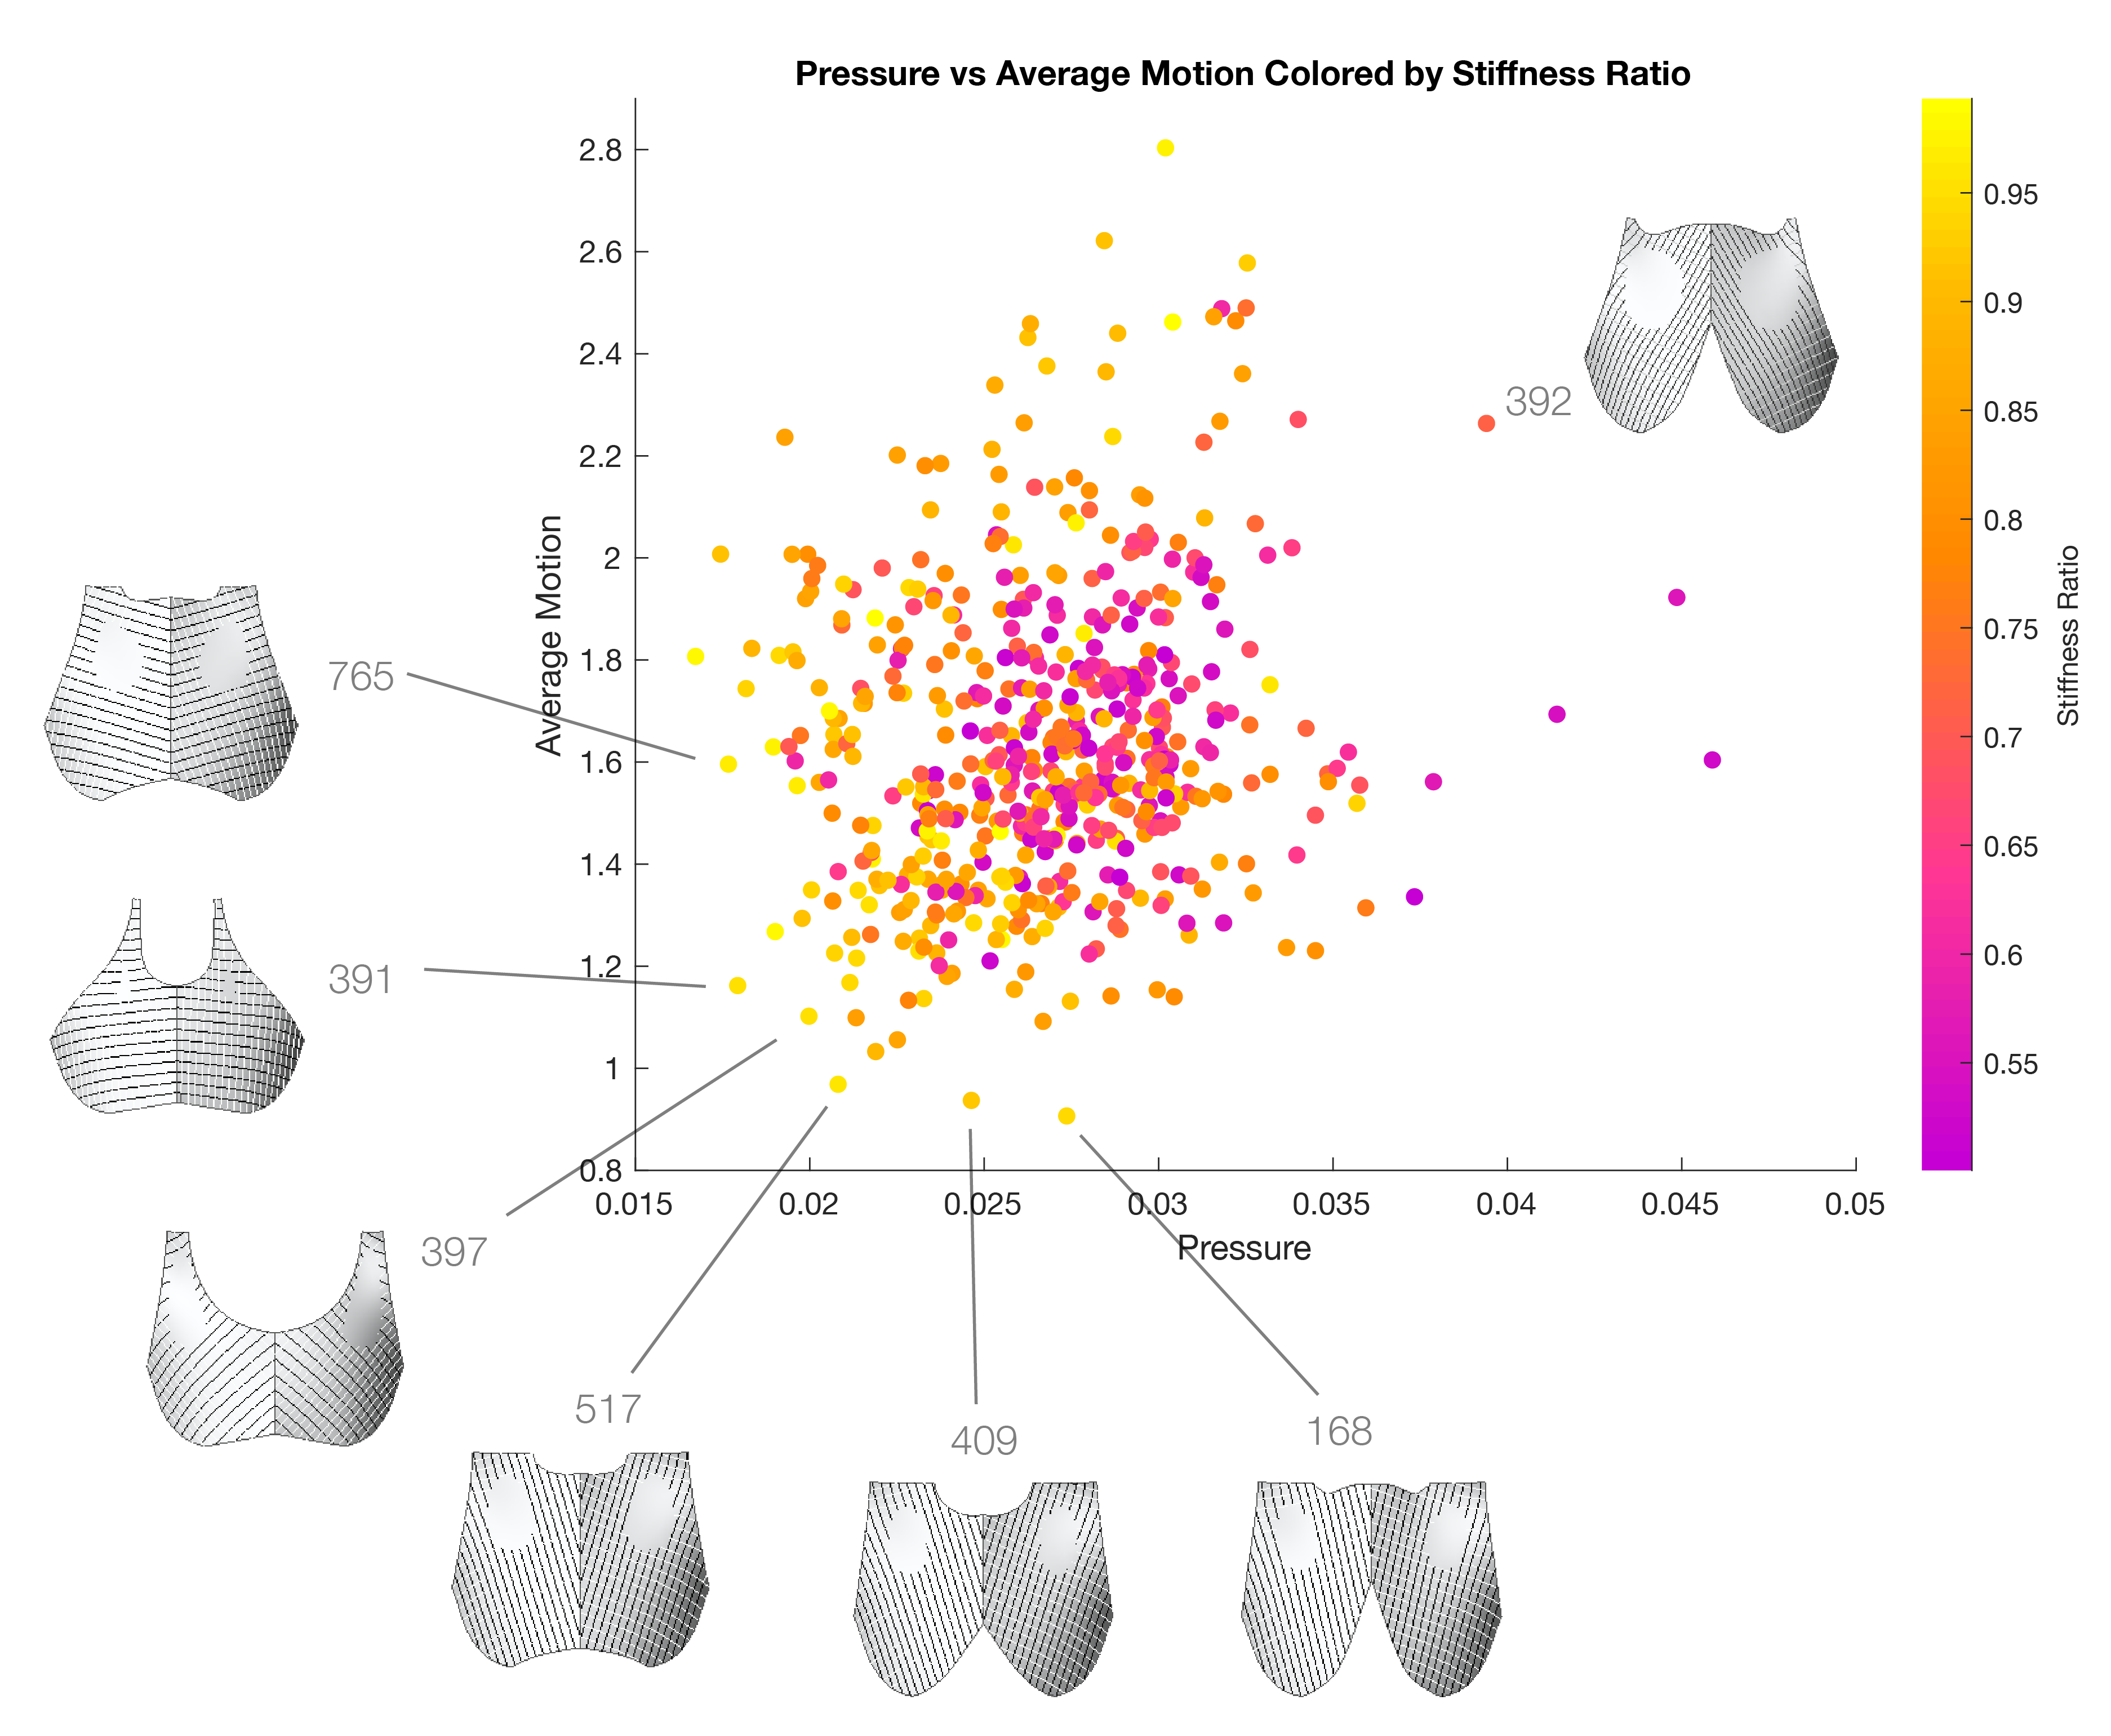
Additional 3-axis plots were generated to identify bi-variable impacts on performance results, with the most significant results suggesting that increased pressure was predicted for designs where stiffness was more distributed:

This diagram serves as a rubric for how the varying ratio and angle parameters relate to the relative stiffness (represented by stroke weight) of each direction of the mesh:
